Power BI / FIG. D6 · FILM
Pixar Films
Box office, critics, awards and the people behind every Pixar film, in one interactive report.
- SOURCE
- Public Pixar films dataset
- DATA
- 10 related tables
- PAGES
- 3
- BUILT WITH
- DAX · dynamic images
01 · THE QUESTION
What makes a Pixar film succeed?
The goal was to see each film's money, reception and creative team side by side, and to compare films, genres and directors across the studio's history.
- Q1How did each film do at the box office, at home and abroad, and what was its return on budget?
- Q2How did critics and audiences rate it (IMDb, Rotten Tomatoes, Metacritic, CinemaScore)?
- Q3Who made it: directors, producers, writers and composers?
- Q4Which genres and directors bring in the most revenue?
- Q5How many Academy Award nominations and wins did it get?
02 · THE DATA & CLEANING
From raw files to clean tables
Ten tables, including films, box office, people, awards, public response, genres and a table of poster links.
- a.Converted Google Drive share links into direct image links for the posters.
- b.Linked people to films by role.
- c.Calculated profit, ROI and box office per $1M of budget.
- d.Joined critic and audience scores to each film.
03 · THE DATA MODEL
One fact table, described by its look-ups
FACT
Pixar films
DIMENSIONS
- Box office
- People
- Awards
- Public response
- Genres
- Posters
04 · REPORT PAGES
What's in the report
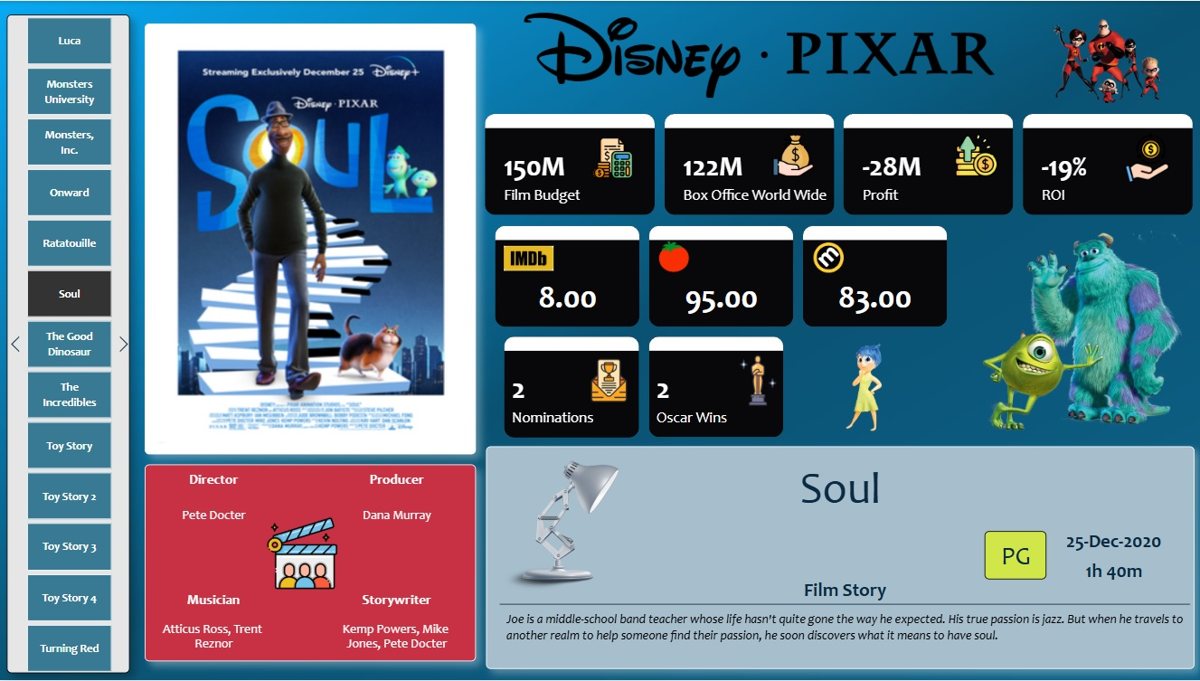
- P1OverviewOne film at a time: poster, budget, box office, profit, ROI, scores, awards and the full crew by role.
- P2BudgetBudget against box office, box office per $1M budgeted, the trend over time and the US/Canada versus international split.
- P3GenreFilms and revenue by genre, revenue by director, and revenue against critic score over time.
05 · FINDINGS
What the report shows
- Which films earned the most and returned the most on their budget.
- How critic and audience scores moved across the studio's history.
- How much each director contributed to total box office.
- Which genres are most common and which earn the most.
- How budget, box office and awards relate.
06 · RECOMMENDATIONS
What to do next
- 01Use ROI, not box office alone, to compare films of different budgets.
- 02Read critic score and revenue together: they do not always move as one.
- 03Use the director view to see where creative leadership paid off.
07 · TECHNICAL CHALLENGES
Problems solved along the way
- CHALLENGE 1Posters from cloud linksDrive share links do not display as images. A DAX measure rewrites each one into a direct link Power BI can render.
- CHALLENGE 2Revenue by directorFilters had to flow from people to films to money, so bidirectional relationships were set up with care.
- CHALLENGE 3Nothing selected, nothing shownDAX shows a blank image instead of a random poster when no film is chosen.
- CHALLENGE 4Many names, one roleA DAX measure joins all writers or producers of a film into one readable line.
See it for yourself.
Open the live report →