Power BI / FIG. D7 · MEDIA
Netflix Titles
What the Netflix catalogue says about the company's content strategy: growth, genres, countries, ratings and co-productions.
- SOURCE
- Public Netflix titles dataset
- DATA
- Movies and TV shows
- PAGES
- 3
- BUILT WITH
- Power Query · DAX
01 · THE QUESTION
What is Netflix investing in, and where?
The report is for content, marketing and leadership teams who need a quick read of the library and its direction.
- Q1How big is the catalogue, and how fast is it growing?
- Q2What is the balance between movies and TV shows, and which genres lead?
- Q3Which countries produce the most titles, and when are titles added?
- Q4Who is the audience, judged by content rating?
- Q5How much is made as co-productions versus stand-alone productions?
02 · THE DATA & CLEANING
From raw files to clean tables
One table of titles with type, genres, countries, director, rating, release year and date added.
- a.Split the comma-separated genre and country columns into one row per value.
- b.Parsed the date added to study growth and seasonality.
- c.Classified each title as a co-production or a stand-alone production.
03 · THE DATA MODEL
One fact table, described by its look-ups
FACT
Titles
DIMENSIONS
- Genre
- Country
- Date added
- Rating
- Director
04 · REPORT PAGES
What's in the report
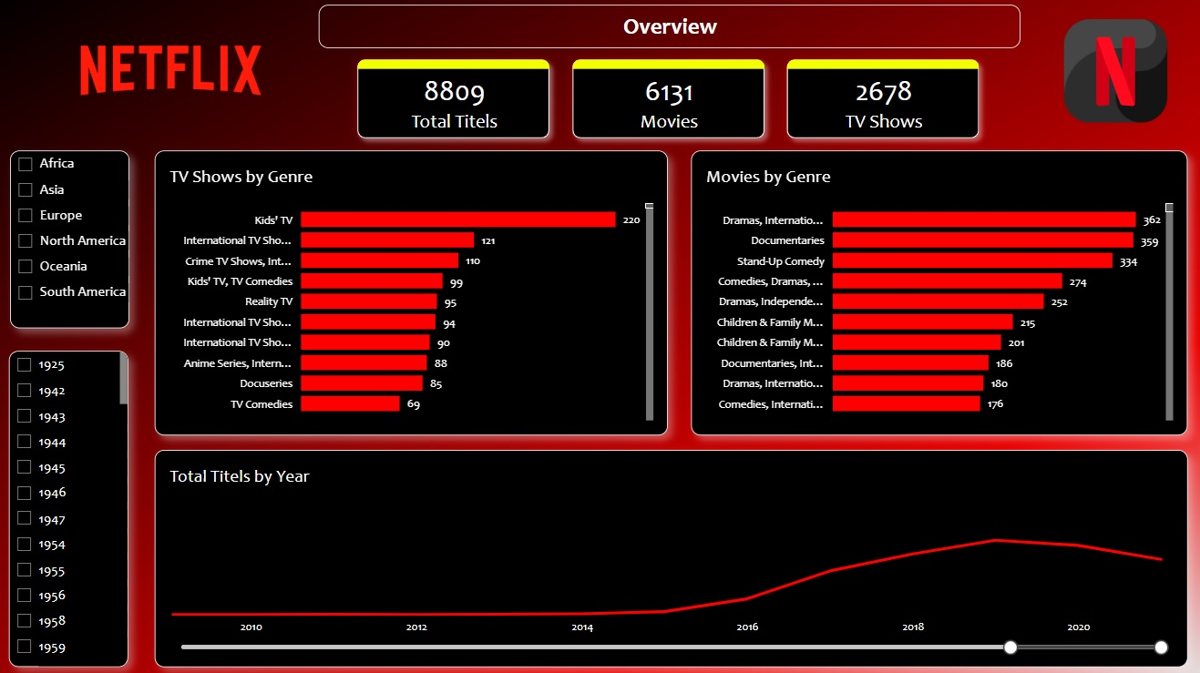
- P1OverviewTotal titles and growth year on year, movies versus TV shows, and the top genres.
- P2GeographyTitles by country, release patterns over time, seasonal additions and the co-production mix.
- P3Audience & productionRatings mix, top directors by number of titles, and co-production versus stand-alone strategy.
05 · FINDINGS
What the report shows
- How quickly the library has grown, and the mix of movies and shows.
- Which genres Netflix invests in most.
- Which countries supply the most titles, and how that has changed.
- The months when new titles are usually added.
- How much content is made with international partners.
06 · RECOMMENDATIONS
What to do next
- 01Add viewership data to link what is offered with what is watched.
- 02Add sentiment analysis of reviews.
- 03Benchmark against other streaming services.
- 04Add parameters so users can test their own scenarios.
07 · TECHNICAL CHALLENGES
Problems solved along the way
- CHALLENGE 1Many values in one cellGenre and country held several values each. Power Query split them into rows so each can be analysed alone.
- CHALLENGE 2No double countingSplitting rows repeats titles, so every title count uses DISTINCTCOUNT.
- CHALLENGE 3Co-production labelA calculated column uses CALCULATE with ALLEXCEPT to count countries per title and label it co-production or stand-alone.
See it for yourself.
Open the live report →