Power BI / FIG. D9 · EDUCATION
Student Mental Health
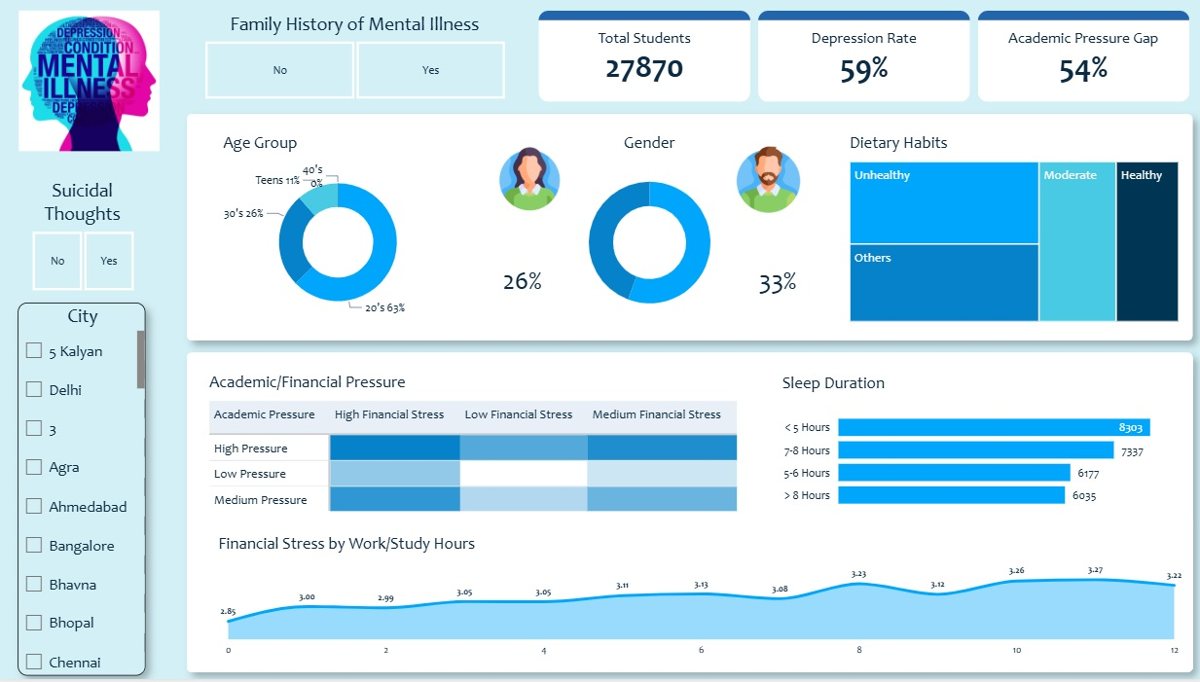
What drives depression among students? 27,901 records point to pressure and circumstance more than family history.
- SOURCE
- Public student mental health dataset
- DATA
- 27,901 student records
- DEPRESSION RATE
- 58% overall
- BUILT WITH
- Power Query · DAX
01 · THE QUESTION
Is student depression about who they are, or what they face?
The project set out to find the root causes behind a high depression rate and turn them into actions a university could take.
- Q1How strongly do academic pressure and financial stress relate to depression?
- Q2What role do sleep and other lifestyle signs play?
- Q3How strong a warning sign is a history of suicidal thoughts?
- Q4Does family history matter as much as current circumstances?
02 · THE DATA & CLEANING
From raw files to clean tables
One table of 27,901 students with academic pressure, financial stress, sleep duration, study habits, family history and a depression flag.
- a.Financial stress was stored as text with "?" values; it was cleaned, then converted to whole numbers.
- b.Sleep duration had stray quote marks; it was cleaned into a Sleep Group column.
- c.A Sleep Rank (1 to 4) was added so sleep can be ordered and plotted.
03 · THE DATA MODEL
One fact table, described by its look-ups
FACT
Student records
DIMENSIONS
- Academic pressure
- Financial stress
- Sleep group
- Family history
04 · REPORT PAGES
What's in the report
- P1The pressure cookerEnvironmental stress: depression rate by academic pressure and by financial stress level.
- P2The warning signsLifestyle and indicators: sleep groups and history of suicidal thoughts.
- P3Circumstance vs historyFamily history compared with current pressures, and a risk view for students facing several stresses at once.
05 · FINDINGS
Key findings
- 58% of students in the data are flagged as depressed.
- Academic pressure is the strongest predictor: 86% at the highest level versus 19% at the lowest.
- Financial stress follows the same pattern: 81% versus 32%.
- Less sleep, more risk: 65% for under 5 hours versus 51% for over 8 hours.
- A history of suicidal thoughts is the strongest single flag: 79% versus 23%.
- Family history matters less than expected: 61% versus 56%.
06 · RECOMMENDATIONS
What to do next
- 01Start proactive outreach for students who score high on several risk factors at once.
- 02Fund programmes that reduce financial stress.
- 03Add sleep screening and support to wellness services.
07 · TECHNICAL CHALLENGES
Problems solved along the way
- CHALLENGE 1Messy data typesKey columns mixed text and numbers and contained stray characters. Power Query cleaned and retyped them before any analysis.
- CHALLENGE 2Showing every studentPower BI aggregates by default. Using the Sleep Rank and the record ID on the scatter chart shows all 27,000+ students as separate points, so clusters are visible.
See it for yourself.
Open the live report →