Power BI / FIG. D2 · E-COMMERCE
Brazilian E-commerce
A four-page report on Olist, a Brazilian online marketplace: sales over time, when people buy, where they live, and how delivery shapes their reviews.
- SOURCE
- Kaggle · Olist public dataset
- PERIOD
- 2016 – 2018
- PAGES
- 4
- BUILT WITH
- Power Query · DAX · maps
01 · THE QUESTION
Five questions for a growing marketplace
The aim was a decision tool to track sales, understand buying habits, judge delivery quality and find what hurts the customer experience.
- Q1How did revenue and orders change by month, year and season?
- Q2Which categories, sellers and regions bring the most revenue, and which have the least happy customers?
- Q3On which days and at what times do people buy, and what does that mean for capacity?
- Q4How reliable is delivery across states and sellers?
- Q5Where is the customer experience inconsistent, and why?
02 · THE DATA & CLEANING
From raw files to clean tables
The Olist tables: orders, order items, payments, reviews, customers, sellers, products, geolocation and a category-name translation table.
- a.Translated product category names from Portuguese to English.
- b.Converted purchase, approval and delivery timestamps, then calculated lead time and delay in days.
- c.Grouped purchase hours into morning, afternoon, evening and night.
- d.Marked each order on time or late against its estimated delivery date.
- e.Calculated the average review score and its standard deviation for each state.
03 · THE DATA MODEL
One fact table, described by its look-ups
FACT
Orders & items
DIMENSIONS
- Date
- Customers & states
- Sellers
- Products & categories
- Payments
- Reviews
04 · REPORT PAGES
What's in the report
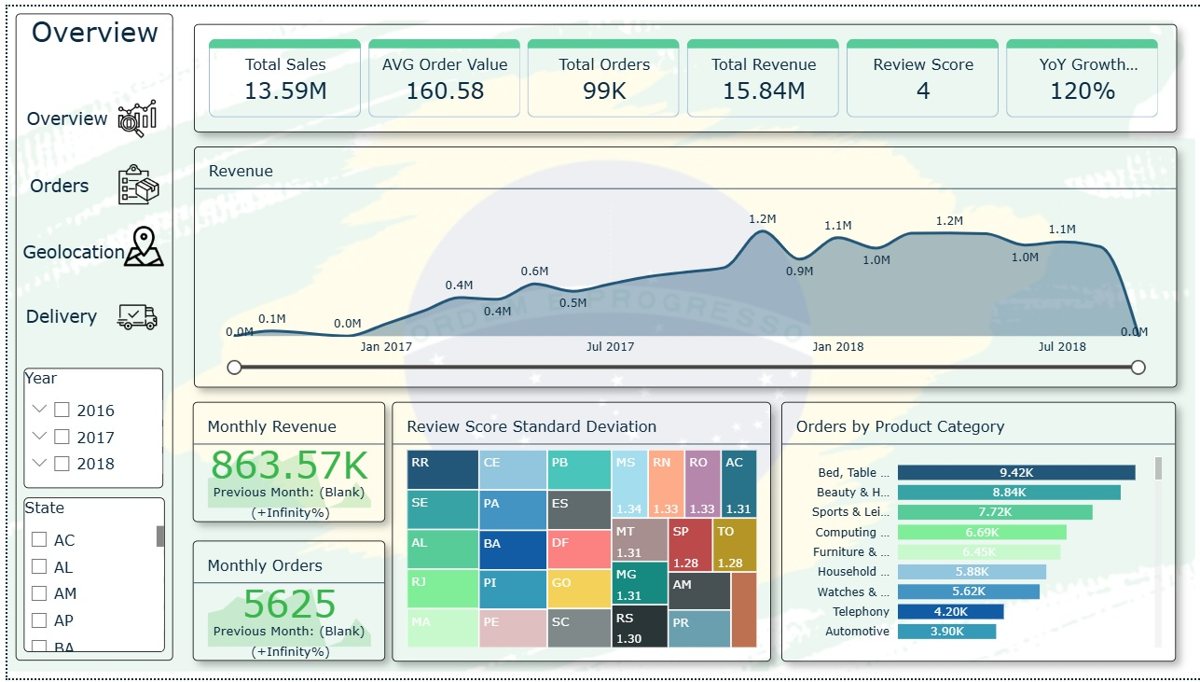
- P1OverviewKPI cards (revenue, orders, average order value, review score, on-time rate, growth), the monthly trend with the November spike, and the top 10 products and sellers.
- P2OrdersA weekday × hour heat map, order status from placed to delivered, payment methods and installments, and orders by time of day.
- P3GeographyA map of Brazil by state with orders, revenue, review score and delivery time, plus a state table with sparklines and review spread.
- P4DeliveryLead-time distribution, on-time versus late by state and seller, delivery time against review score, and the list of longest-delayed orders.
05 · FINDINGS
Key findings
- Orders jumped in November 2017, in line with Black Friday and the holiday season.
- Sales grew from 6.2 million in 2017 to 7.4 million in 2018, about 19%.
- Weekdays beat weekends, and Monday is the strongest day.
- The afternoon brings almost 38% of all orders.
- Almost every order was delivered, a good sign for operations.
- States with a high spread in review scores have an uneven experience: some customers are very happy, others very unhappy.
06 · RECOMMENDATIONS
What to do next
- 01Plan stock, staff and promotions ahead of November.
- 02Run campaigns and staff customer service for weekday afternoons.
- 03Investigate the states with the most volatile reviews first.
- 04Compare delivery times by state to target logistics fixes.
- 05Follow up on the longest-delayed orders one by one.
07 · TECHNICAL CHALLENGES
Problems solved along the way
- CHALLENGE 1Tables at different levelsOrders, items and payments repeat at different levels of detail. Orders became the hub of the model so revenue is never counted twice.
- CHALLENGE 2Measuring consistencyAn average score hides unhappy customers. Standard deviation of review scores by state shows where experience is unstable.
- CHALLENGE 3Linking delivery to reviewsDelivery time and review score were placed on one scatter chart to test whether late orders drive low scores.
See it for yourself.
Open the live report →